Defining and managing metrics is a key aspect of being a good PM. Managing a product without metrics is like 🏃🏻♀️ running around in a maze. You haven’t kept track of where you’ve been, and you’re not sure 🤷🏻♀️ what to do to get out. As a PM, you start with defining the key metrics that help measure the impact of the product, and identify areas of improvement. Then you set up mechanisms to monitor these metrics regularly, and manage unexpected changes in those metrics (e.g. a sudden dip in #downloads or a sudden spike in loading time). In this article, we will cover how to define the right metrics for your product and set metric-based goals to measure product impact. In part 2 of the article, we will discuss how to manage unexpected changes in your metrics.
Defining key metrics to track
We will take the example of the 🧘🏻♀️ meditation app - “MeTime” that we built together in the first article by The Product Mentors. A quick refresher in case you missed the article, MeTime was focused on millennial women and had the following features as part of the Minimum Delightful Product, or the first version of the launch:
A Customized experience for women: Meditation categories tailored to the unique needs of working women that came up in our research including mood fluctuations due to hormonal changes, expectant women, women who have suffered childbirth loss, work-life balance, managing imposter syndrome at work, managing body image issues, improving self-worth, and Mindful eating
The basic app features like creating and managing profiles, meditation list with categories, search and discover
Broad selection on available meditation options based on duration (2min options to hour-long options)
Reminders and ability to track progress to help build a habit around it
Let’s go through the process of defining the right metrics for MeTime together!
Metrics can be broadly classified into 3 categories:
🤩 Customer delight metrics: These metrics help us measure customers’ overall sentiment towards the product and its key features. For MeTime, these would be metrics like App Store rating, App Store reviews, Overall CSAT score, Net Promoter Score.
💉 Product health metrics - These metrics help evaluate whether the product is available & performing in the manner that customers find reasonably. For MeTime, these could be metrics like App launch time, Meditation loading time, ANR (application not responding rate), Login error rates, crash rate, etc.
🔻Funnel metrics: These metrics help measure the overall success and business impact of the product from generating a lead to converting the lead into a paying customer. There are three stages of a typical product funnel:
The Funnel
Top of the funnel: Here, the focus is on lead generation. In our context, it is getting more customers to know about MeTime and try it out. There are primarily two types of top of funnel metrics:
Awareness metrics - Help us track how many customers know that MeTime exists! Potential customers are drawn into this stage through marketing campaigns or generating awareness via events, advertising, content (blog posts, infographics, etc.), webinars, direct mail, viral campaigns, social media, search, media mentions, and more. Key metrics that help us determine the efficacy of these activities and the overall awareness of MeTime could be #App Store views, social media footprint, #references, #tweets, #news coverage, etc.
Acquisition metrics: Help us track how many customers have indicated a willingness to use MeTime. Key metrics to determine this could be #App store downloads, sign-ups, logins, click-through rates on blogs, articles, etc. We can also measure customer acquisition cost (CAC) to track how much are we spending on acquiring new customers.
Middle of the funnel: Here, the focus is on nurturing the generated leads and having the customers explore MeTime in greater detail. We track:
Adoption metrics: Help us track how many customers try out MeTime after downloading and login into the app. This includes metrics like Daily, weekly, monthly active customers.
Engagement metrics: Help us track how many customers use MeTime consistently. Key metrics to track are average #logins per day, time spent per session, #features used per session. Note that since this is a wellness app, a daily cadence works better than weekly or monthly.
Bottom of the funnel: Here the focus is on monetization, and converting the engaged customers into paying customers. We track:
Retention metrics: Of the engaged customers, what % churns vs how many continue to engage. The retention cycle is the minimum duration that a customer has to continue to use your product before we consider them as ‘retained’ or converted. For a consumer app like MeTime, it could be 1-2 months, for an enterprise product, it could be 12-15 weeks, and can be figured out after some trial and error. Other key metrics include conversion rate (% that continue to use the product after the retention cycle), churn rate.
Monetization metrics: Finally, the monetization metrics tell us what % of customers end up paying for the app, how much are they paying, etc. Key metrics to track are revenue, ARPU(average revenue per user), % paid-customers.
Goal setting and monitoring metrics:
Metrics are helpful only if you have a goal or target for these metrics. Also, at different stages of the product, you might choose to focus on different metrics. For example, as we launch MeTime or during the early days of launch, our focus will be on top of the funnel metrics like awareness and acquisition. Let’s assume that at launch, we start a Facebook page for MeTime, a launch blog, and paid ads on Facebook. Within the first 30 days of launch, our primary goal is to have 100K downloads. Out of these 100K downloads, we are targeting 50% (50K) comes from Facebook ads, 10% (10K) comes from our launch blog, 20% (20K) comes from the Facebook page, and 10% (10K) are organic customers (e.g customer who come via word-of-mouth and not via a marketing channel). We will now track if our total downloads are on track and if our acquisition channels (Facebook page, launch blog, Facebook ads) are on track in terms of their subscriber % contribution targets. If these metrics are below target (say Facebook Ads), we might want to deep dive into the ‘why’, and change strategy accordingly. E.g., if we are not spending enough, we increase our spending, or if we learn that our target customers are not on Facebook, we reduce that spending and try a different strategy like engaging an Instagram wellness influencer. Similarly, if we are exceeding expectations on the target, we might want to double-down on that opportunity and spend more. For MeTime, as we graduate to more mature stages (60 days, 90 days, 180 days from launch), our prime focus might shift from awareness to engagement, to retention to monetization.
The entire duration from stage 1: Awareness to stage 6: Monetization is called the Sales Cycle and it determines the overall velocity of your funnel i.e. the rate at which you convert leads into paying customers. Needless to say, you want to have as short sales cycles as possible. As PMs, you might also want to set goals around how your want to progressively reduce the Sales Cycle over time (e.g at launch it is ~3 months, but we will progressively reduce it to 1 month by the end of 12 months). Other velocity metrics feed into the overall sales cycle like time-to-onboard (for MeTime, it will be the average time customers take from app download to usage), win-rate (what % of your engaged customers end up becoming paying customers), etc. Where you stand against these goals has an important bearing on the overall product strategy - for instance, if your time-to-onboard is higher than your target, you might want to focus on adding features that make onboarding easier. Similarly, if your win-rate is lower than expected, you might want to think about the additional value add in the paid version.
Now that we have defined metrics and have set goals for these metrics, it's important to make it easier for yourself and everyone on the team to keep these metrics top of mind and build a thriving data-driven culture. Below are some tactics to aid this process:
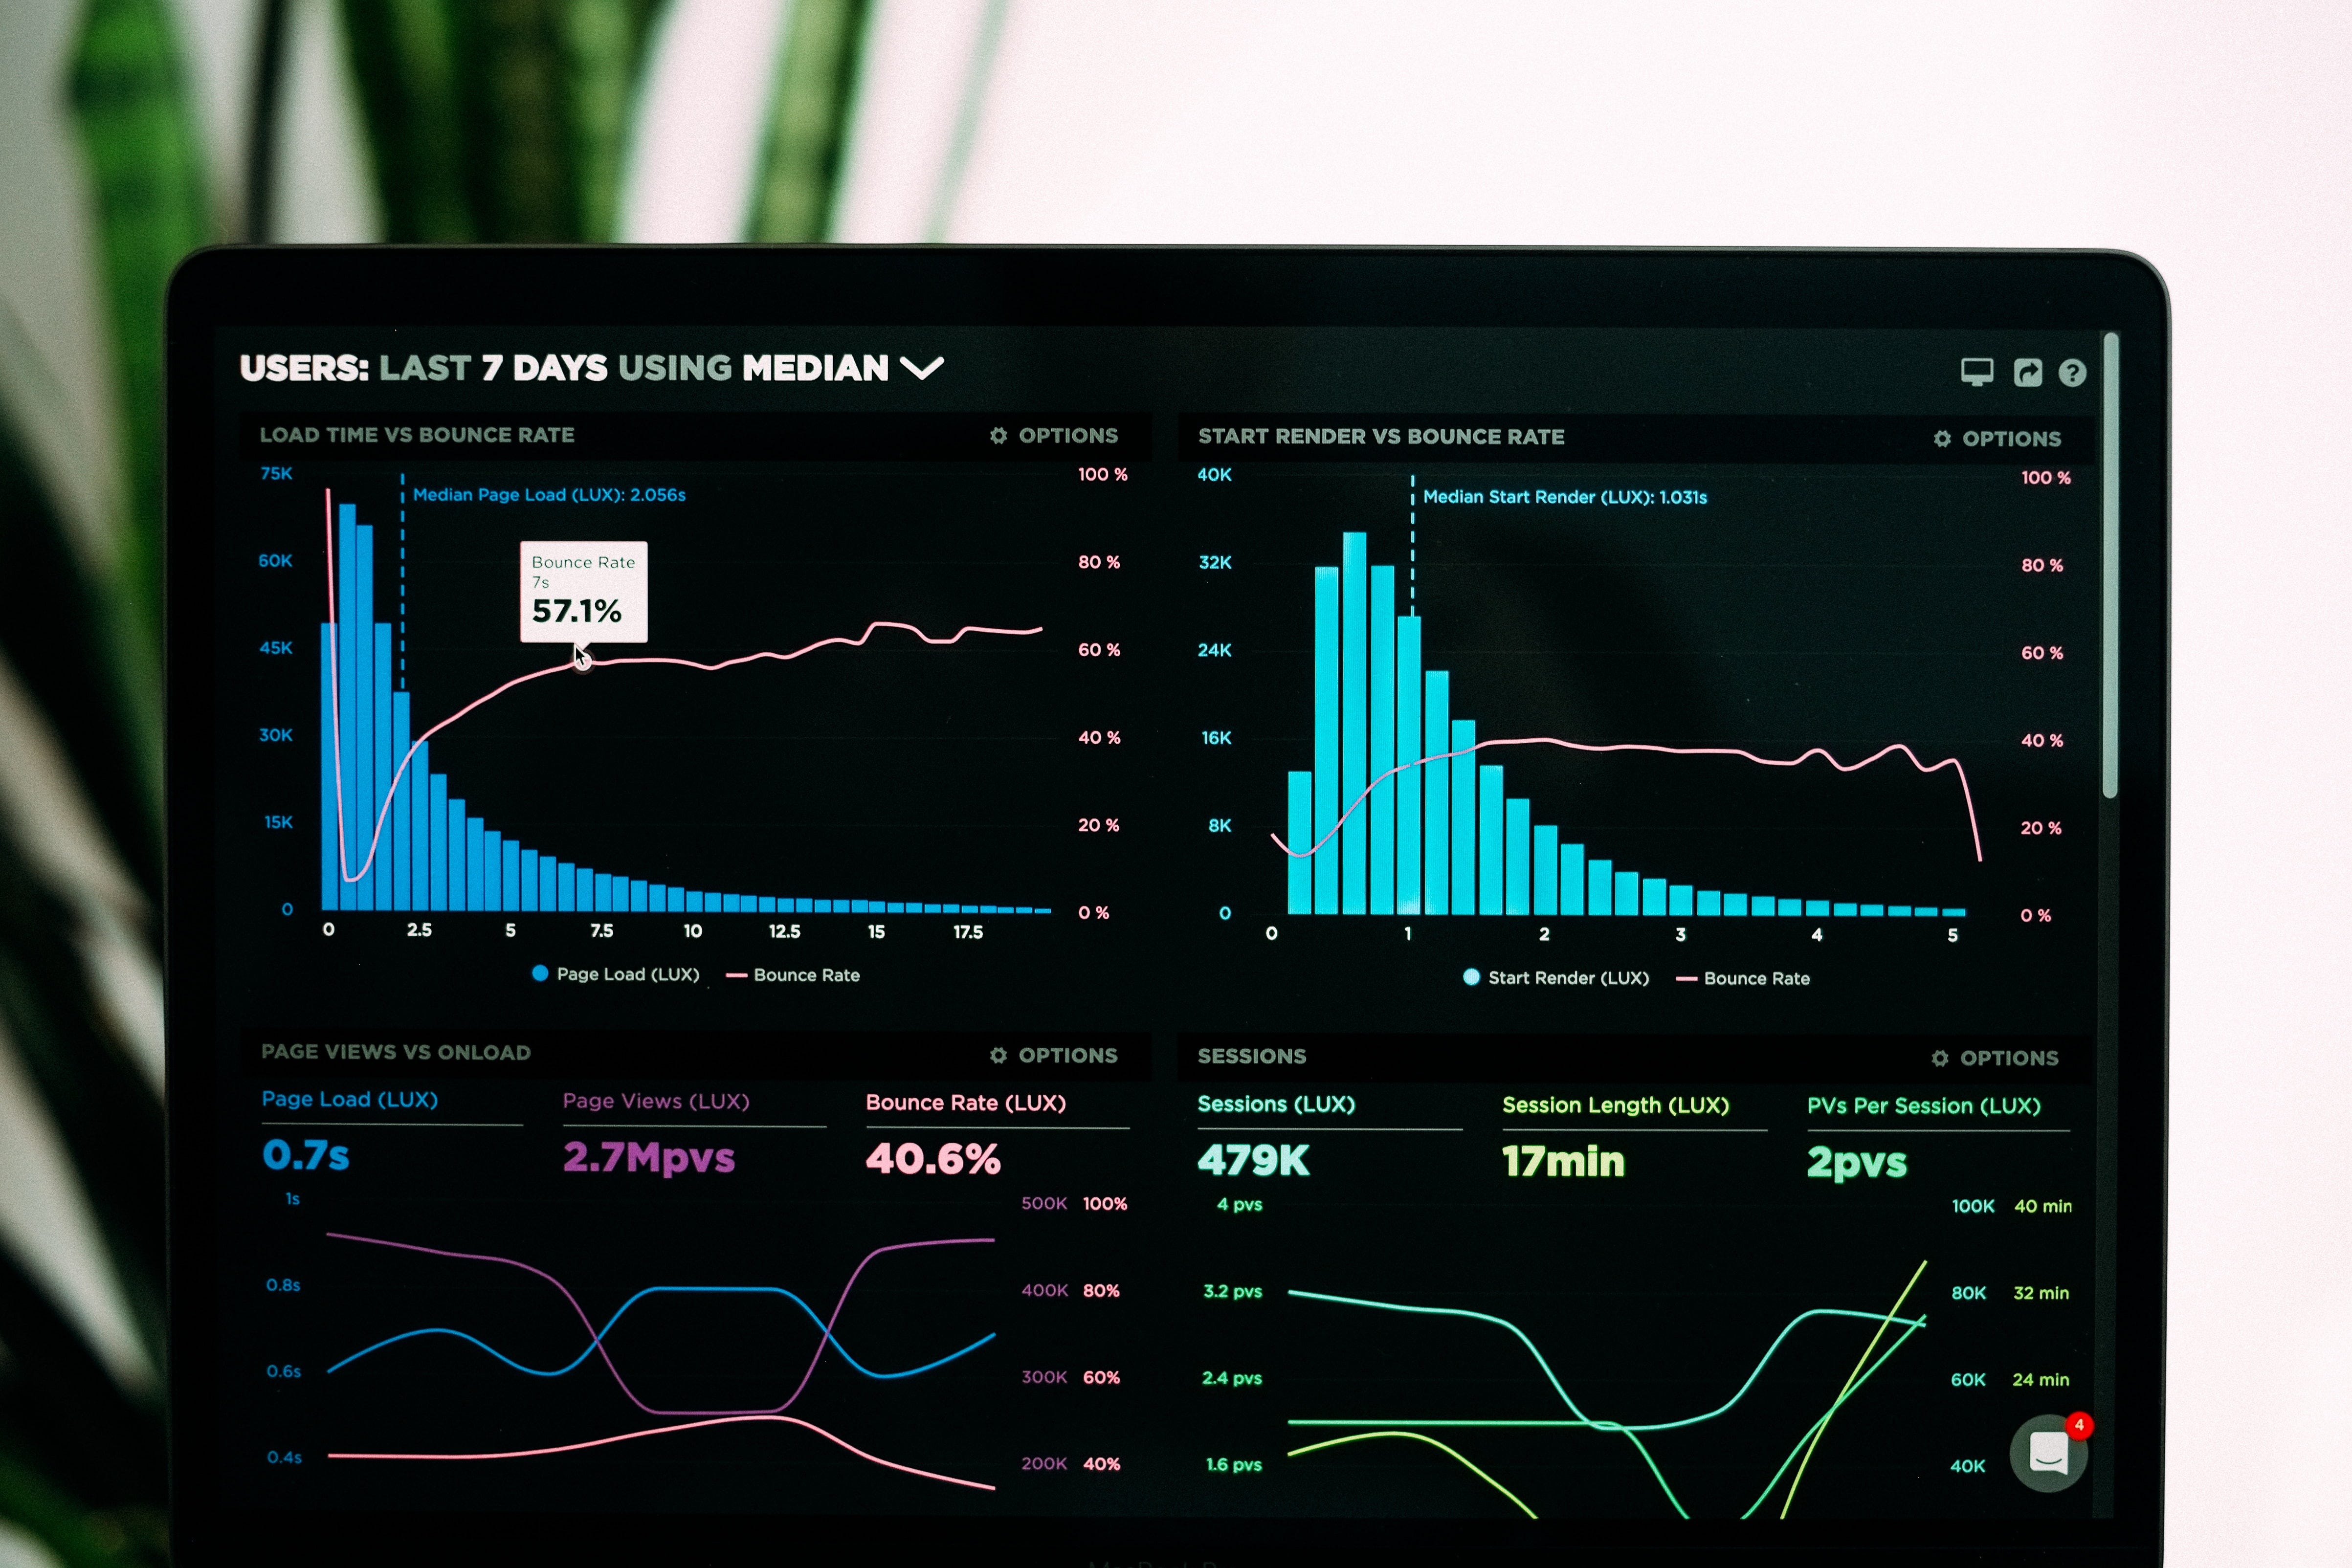
📈Treat your metrics dashboard like a product e.g. Focus on the readability of metrics at a glance, interpretability, etc.
🎯Track the metrics! This may seem obvious but is so often forgotten. Building a product dashboard is futile if it's not used regularly to track metrics.
📌Set a pinned tab on your browser for the product dashboard
🔍Review the pinned tab every N days. We encourage doing this daily to internalize your metrics. Set a calendar reminder or send an automated daily email summary to yourself to build the habit.
🗓Set a weekly email report to be sent out to the team and/or to leadership. Add themes, trends, observations, and learnings in addition to the numbers, as they change week-over-week.
📝Be prepared to adjust your product roadmap and targets as new themes and learnings emerge.
🤓Have mechanism and SOPs to quickly deep-dive whenever there are unexpected changes in these metrics. More on this in the next article!
⚙️Automation is key - don’t spend too much time pulling, collating, and analyzing your metrics manually.
We hope this article helps you get started on defining metrics and goals for your product. Let us know what you think in the comments below and stay tuned for the next article where we will talk about how to manage sudden changes in your product metrics.
Also, don’t forget to subscribe to our newsletter to receive updates every week 📆 on more product learnings. Tell about it to your friends so that they can join us on this journey 🤜🏻🤛🏻 We would love any feedback here.