Metrics that Matter - Part 2
Managing unexpected changes in your metrics


Metrics or key performance indicators for your product are an indicator of the health of your business. Sudden, unexpected spikes or dips can be indicative of an issue, like a technical glitch preventing customers from using your product or a marketing channel showing exceedingly high customer conversions, pointing to an untapped business opportunity. As a PM and owner of the business, you want to identify these unexpected changes and respond promptly. Delayed responses could cost you millions of dollars, missed opportunities, and the risk of losing customer trust.
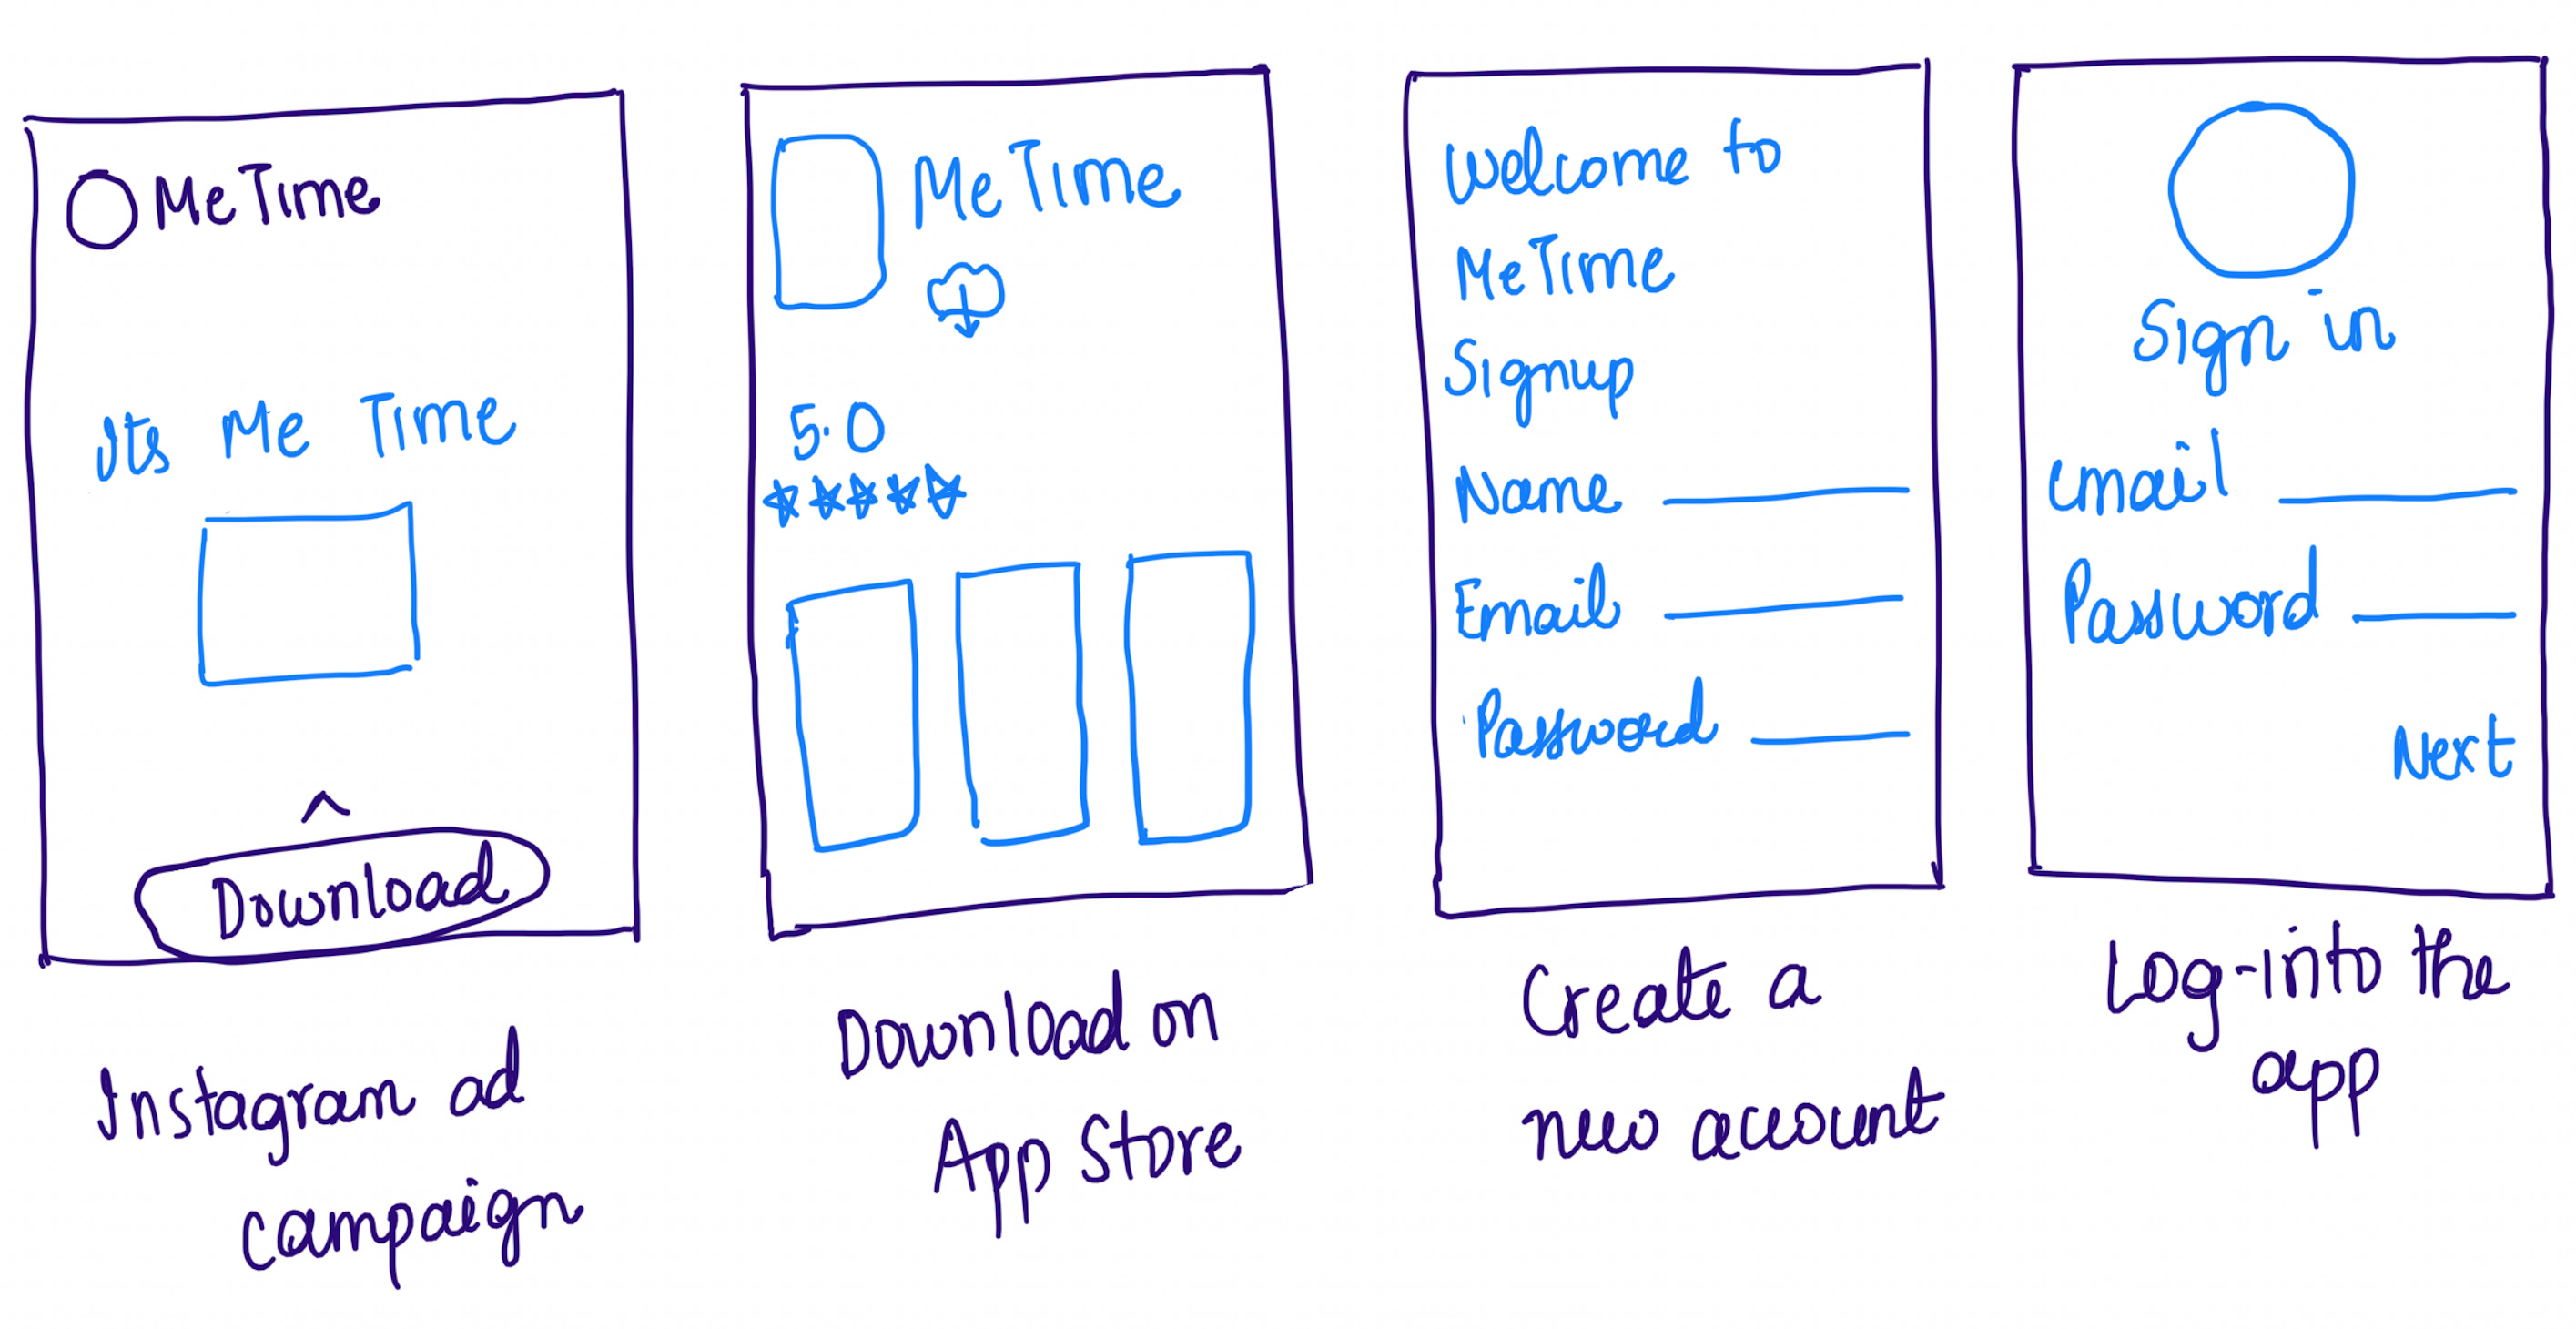
In this article, we will establish a framework for identifying the root cause for such unexpected changes, using the example of the 🧘🏻♀️ meditation app - “MeTime” that we built together in the first article by The Product Mentors. A quick refresher in case you missed the article, MeTime is a mobile app that helps improve the mental health of millennial working women professionals. MeTime app has a customized experience for women, with meditation categories tailored to their unique needs along with progress tracking and reminder capabilities.
In Part 1 of Metrics that Matter, we discussed how to define the right metrics for your product and set metric-based goals to measure product impact. In Part 2, we will focus on managing unexpected changes in these metrics. Let’s assume MeTime has been launched in the market for a couple of years and is seeing steady user growth. One morning, you as the Product Manager for MeTime, are looking at the metrics dashboard and notice a decline in new users by 10%. Below is a step-by-step breakdown of how you might identify the root cause of this issue and respond to it.
Step 1: Investigate any tooling or logging errors 🛠 ⚙️
It is a good practice to ensure there haven’t been any tooling changes or migrations leading to inaccurate data e.g. some data pipelines might be broken or an ETL job (“Extract, Transform, Load” - Wiki link) might not be running as expected.
Similarly, it’s important to ensure that the metric definition hasn’t changed - in this example, you might want to make sure there isn’t any change to the logic of calculating new users on the app. You would check this with the dashboard owner or your business intelligence team.
Step 2: Narrow down the scope of the problem by gathering more context 🔻🔻
This step helps you get clear on the exact problem by segmenting the data along multiple dimensions. Note that there isn’t a priority in which you should approach isolating the problem- the goal here is to be comprehensive. Over time, you will build your intuition to prioritize some data cuts/segments over the others to isolate the problem quickly.
Seasonality: Check if this issue is seasonal - e.g say during the winter holidays, women don’t feel as stressed causing lesser new user activations. You can look at the historic data trend to identify such seasonality.
Sudden vs Gradual: Understand if the 10% drop is sudden or gradual over a period of time. If it is the latter, note when the new-user metric started its downward trend.
Geographic: Understand if the #new-users has changed across the entire user base or whether it is isolated to a particular geography.
Device type: Understand if the #new-users have declined on all surfaces i.e web, desktop, iOS app, Android app, or a specific device type is causing the decline.
OS, Browser, App versions: Identify if #new-users have declined across all operating systems, browser types, and app versions or if there is a specific category causing the decline.
User Demographics: Identify if #new-users have decreased across the entire user base or a particular demographic is prominent - in this example, let’s say it is women in a particular ‘age group’ not activating the product.
Acquisition sources: Understand if a specific user acquisition channel is causing the decline - Let’s say Google, Facebook, and Instagram ads are the primary user acquisition sources for MeTime. In this example, you may want to check if #new-users have declined across all three of these or if one is prominent i.e say #new-users acquired via Instagram ads have reduced predominantly.
Funnel Analysis: The typical funnel in this example may look like
Users see an ad for the MeTime app on Instagram
Users click on the ad and navigate to App Store
Users download the app
Users launch the app
Users create a new account
Users sign in using these new credentials
Users are successfully logged onto the app
Users use the app for a certain time duration
It is helpful to do a funnel analysis to understand where the new-user drop-offs are occurring e.g #new-users launching the app could be constant but the #new-users creating a new account can drop significantly
Once you have isolated the issue, the next step is to build a set of hypotheses around the underlying cause.
Step 3: Build a set of hypothesis on the cause of the issue 📔 📕
The Internal/External framework can help you build a comprehensive set of hypotheses to test and identify the root cause. An internal change is a change that the team may have introduced in the product during software development while an external change could be anything and everything outside the product e.g competition, a macro event such as a natural disaster, etc. Below is a list of some common internal and external causes followed by an example of how you may apply it.
Internal causes:
Change shipped by the team
New Feature: A new feature that was shipped (say in the login flow) could cause user confusion and drop-offs. If this feature is behind an experiment- it may be useful to compare control and test groups to see if #new-users have declined across both these user groups. If yes, then the feature may not be the cause of the problem and you will need to evaluate other hypotheses. But if #new-users have only changed in the test group, this will help you confirm that the feature change shipped was the root cause of the problem of #new-users decline
Bug: A bug might have been introduced that may be causing more friction for new users leading them to drop off
Pricing: A new pricing change could result in fewer users being willing to use the app
Marketing change:
Store Messaging: A change in the marketing message on the App Store or Play Store could result in fewer users downloading the app
Ads messaging: A change in ad content could lead to fewer users trying the app
External Causes:
Competition: The launch of a competitor product with ad campaigns could decrease the MeTime ad conversions
Macroeconomic factors: Large events like recessions, trade wars, political campaigns, or regulations could potentially ban, block or slow down the product growth
Outages: Power outages or internet cutoff could lead to some regions not having access to your app. i.e. say you find out that a particular geographic region is prominent for new user decline and the decline has been since 1 day. Internet cutoff could be one of the possible causes of the problem
Natural calamities: A natural disaster could have led to unrest in particular geography causing #new-users to decline
Change in User behaviors: Finally, it’s quite likely that evolved user preferences are causing a decline in #new-users. In this case, the decline would likely be gradual and spread over a longer duration
Step 4: Identify the root cause & respond. Build fail-safe mechanisms. 🛠⛑
In this final step, you will validate/invalidate your hypotheses, to identify the root cause. Once you have identified the root cause, you can decide how to respond to the problem and build mechanisms and processes on the team to avoid such dips in the future.
Let’s see Steps 1 through 4 in action:
Problem: #new-users on 🧘🏻♀️MeTime have declined by 10%
Let’s assume that #new-users are defined as users that have downloaded and logged into the app successfully once and that this metric is measured daily.
Step 1: Investigate any tooling or logging errors 🛠 ⚙️
Is it due to a tooling or logging change? → No
Step 2: Narrow down the scope of the problem 🔻🔻
(Question → Finding)
Is it seasonal? → No
Is it sudden or gradual? → This has happened over the last day
Is it constrained to a particular geography? → It’s across the entire user base
Is it happening on a particular device type, OS type, browser type, or app version? → Yes it’s happening on the latest app version
Is it across a specific age range? → No
Is the decline from a particular Acquisition source? → Yes the decline is more prominent via Instagram ads
Is a particular part of the funnel broken? → By looking at #new-users, we see that number of users clicking on Instagram ads has not changed, #users downloading the app has not changed but the #new-users creating an account has declined
In summary, we now know that the change is sudden, it’s due to an issue with Instagram as the acquisition source and it’s happening at the point where users are trying to create an account.
Step 3: Build a set of hypotheses around what might be causing the issue 📔 📕
Based on the narrow scope of the problem, you can now build a set of hypotheses to identify the cause. Since you know that #new-users are declining at the account creation stage, the logical next step is to check if there was a feature shipped particularly in the new account creation process? → Say you checked with the team and found out that a new feature was shipped altering the new user signup flow via Instagram and this change was shipped behind an experiment couple of days ago.
Is the #new-user conversion rate in the control and test bucket the same? → No, the test bucket shows a sharp decline of about ~10%
Great! You have now narrowed down the root cause to be this new experimental feature and validated it.
Step 4: Identify the root cause & respond, build mechanisms to avoid such issues in the future 🛠⛑
Once you have identified the root cause being this experiment you have 3 choices
Do nothing → Not an option!
Let the experiment run for the intended duration → Also not an option as no company wants to lose new users
Stop the experiment and revert the change → You decide to go for this option
Next, you may work with the team that shipped this change and isolate where the new user sign-up flow was broken because of the change as well as brainstorm how to avoid such issues in the future e.g. the team can select a smaller test bucket for such risky changes to avoid such a high magnitude decline OR any changes to login flow must undergo a much more rigorous QA process
Now that you have identified the root cause of this issue and worked on fixing it, you can proceed to your next product deliverable 🚀
We hope you found this article helpful in narrowing down the problem and identifying its root cause. Remember that for any of these to apply, it’s important to be monitoring your metrics dashboard daily or having alerting mechanisms in place to notify you.
Also, don’t forget to subscribe to our newsletter to receive updates on more product learnings. Tell about it to your friends so that they can join us on this journey 🤜🏻🤛🏻 We would love any feedback here.
(PS: Ankita Verma has recently launched a new AWS service that can automatically detect and diagnose anomalies in business and operational metrics. Check it out here)